CleanNYC Database
A database for community district sanitation analysis
PURPOSE
This project creates a database of community district socioeconomic data, sanitation infrastructure, and 311 complaints. It allows users to access, compare, and analyze information typically spread across various datasets. With this database, potential users such as city planners, journalists, and urban researchers can pull data to analyze the relationship between neighborhood demographics and sanitation infrastructure, compare city services across various geographies, or simply understand the distribution of sanitation-related service requests throughout the city. Whether for exploratory insight or more formal statistical modeling, this schema opens the door for multi-layered analysis.
Users of the database can be community members, activists, governmental workers, students, or data analysts. The database could be useful to users who would simply like to explore a certain community board or neighborhood in New York City by examining the census data mentioned above. Such a user could also explore multiple community boards across the City based on census variables chosen. Government workers can use the database to create an educational tool, such as a dashboard, that explains different New York City geographies, like borough or community board/community district tabulation area. Analysts can use the database to access data for further analyses, such as regressions and multivariate correlations, to examine the relationship between and amongst the variables listed above. These users could also use the data gathered to make visualization communicating their findings, or to simply visualize descriptive statistics of chosen variables.
Examples of such analyses include a longitudinal analysis of 311 complaints in a certain community district or borough, or perform a regression analysis on litter basket service requests and median household income. A user could examine 311 complaints pre- and post-COVID-19, or create a map exploring the relationship between population density and litter basket placement. Users can get even more granular and examine 311 complaints by type and compare this number across the City as it relates to chosen census data.
RESEARCH QUESTIONS
How do income levels and racial demographics influence the frequency and type of sanitation-related 311 complaints across New York City's community districts?
What is the relationship between the availability of sanitation infrastructure (e.g., litter baskets, waste transfer stations) and the frequency of sanitation-related complaints in different community districts?
Do community districts with higher median household incomes have better sanitation service coverage (such as refuse collection and litter baskets), and how does this correlate with the number of 311 complaints in those districts?
METHODS
I began by developing business rules based on the available data sources and the core questions I hoped to answer with the database. These business rules helped identify the key relationships between neighborhood demographics, sanitation infrastructure, and 311 complaints.
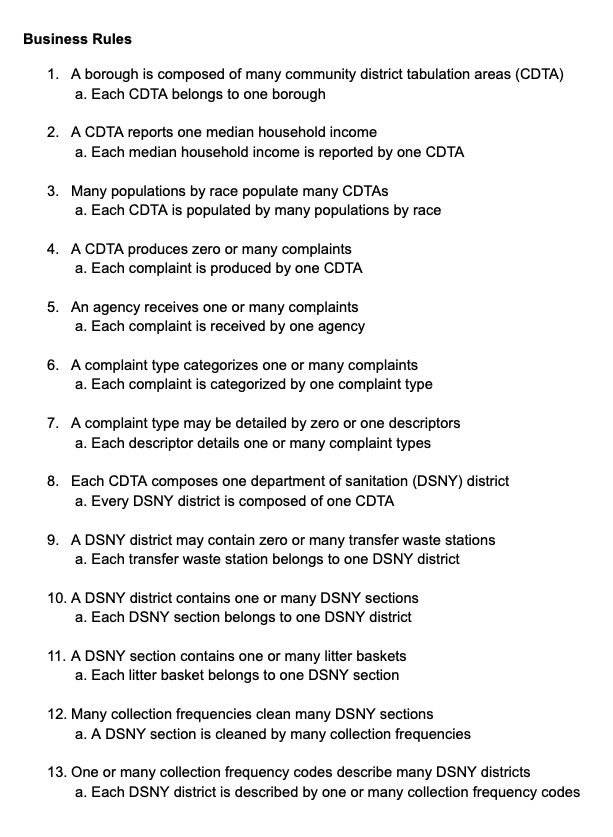
Next, I created a conceptual data model using Crow’s Foot Notation to represent the major entities and their relationships. This high-level model enabled me to visualize how different types of data—such as race demographics, sanitation services, and complaints—interacted across New York City’s community districts.
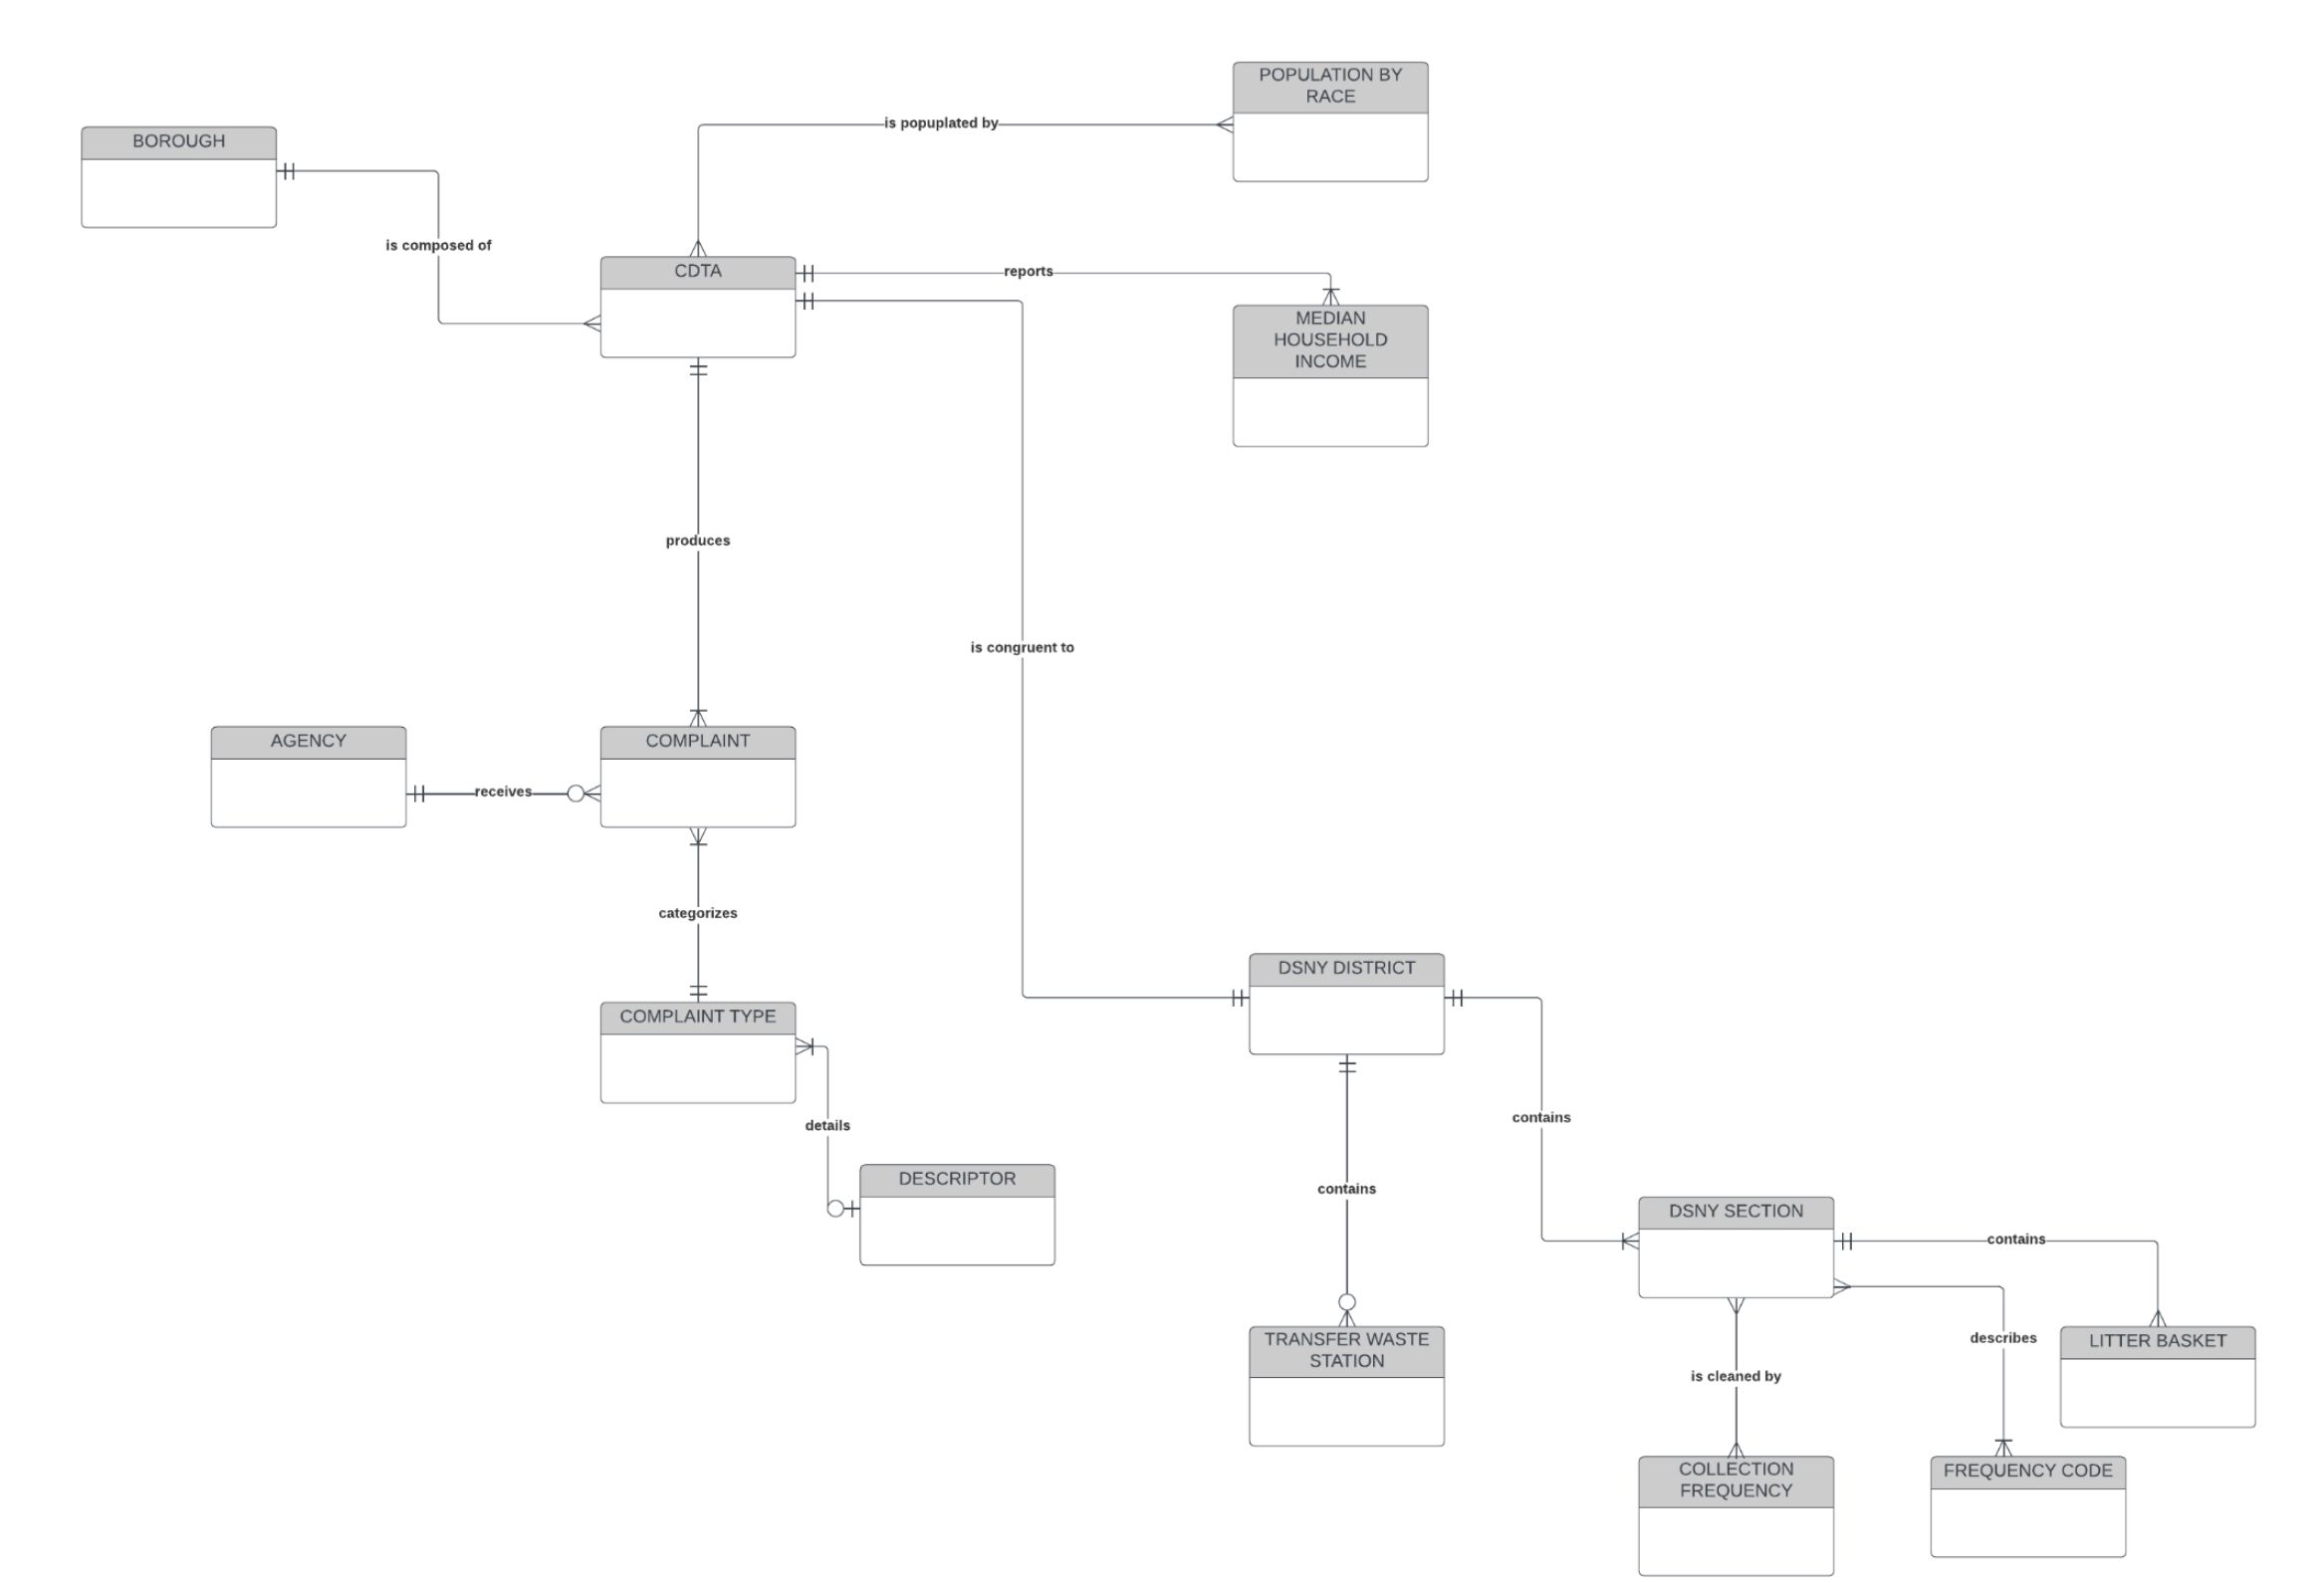
Following the conceptual design, I moved on to constructing my logical data model, also using Crow’s Foot Notation. This version introduced attributes for each entity and formally captured the relationships between them. I applied normalization principles up to the third normal form (3NF) to eliminate redundancy and ensure data integrity.
Summary of Changes
During the development of the logical model, two many-to-many relationships required normalization:
1. CDTA ↔ Population by Race
Many “population (count) by race” records are associated with many “community district tabulation areas” (CDTAs), so I introduced an associative entity called CDTA Population Demographics to resolve this relationship. This change not only maintained relational integrity but also allowed the creation of a dynamic and updateable Census Race Group table. The structure supports future additions or changes to racial categories—such as the relatively recent inclusion of the “Two or More Races” designation—making the schema more flexible and future-proof.
2. DSNY Section ↔ Collection Frequency
Since each DSNY section can be cleaned multiple times per week and each collection day covers multiple sections, this also required normalization. I created an associative entity called Section Refuse Collection Frequency and a supporting Refuse Collection Day table. Additionally, I added a Refuse Collection Code to categorize collection patterns, enabling users to analyze sanitation frequency by collection group or day—not just raw frequency numbers.
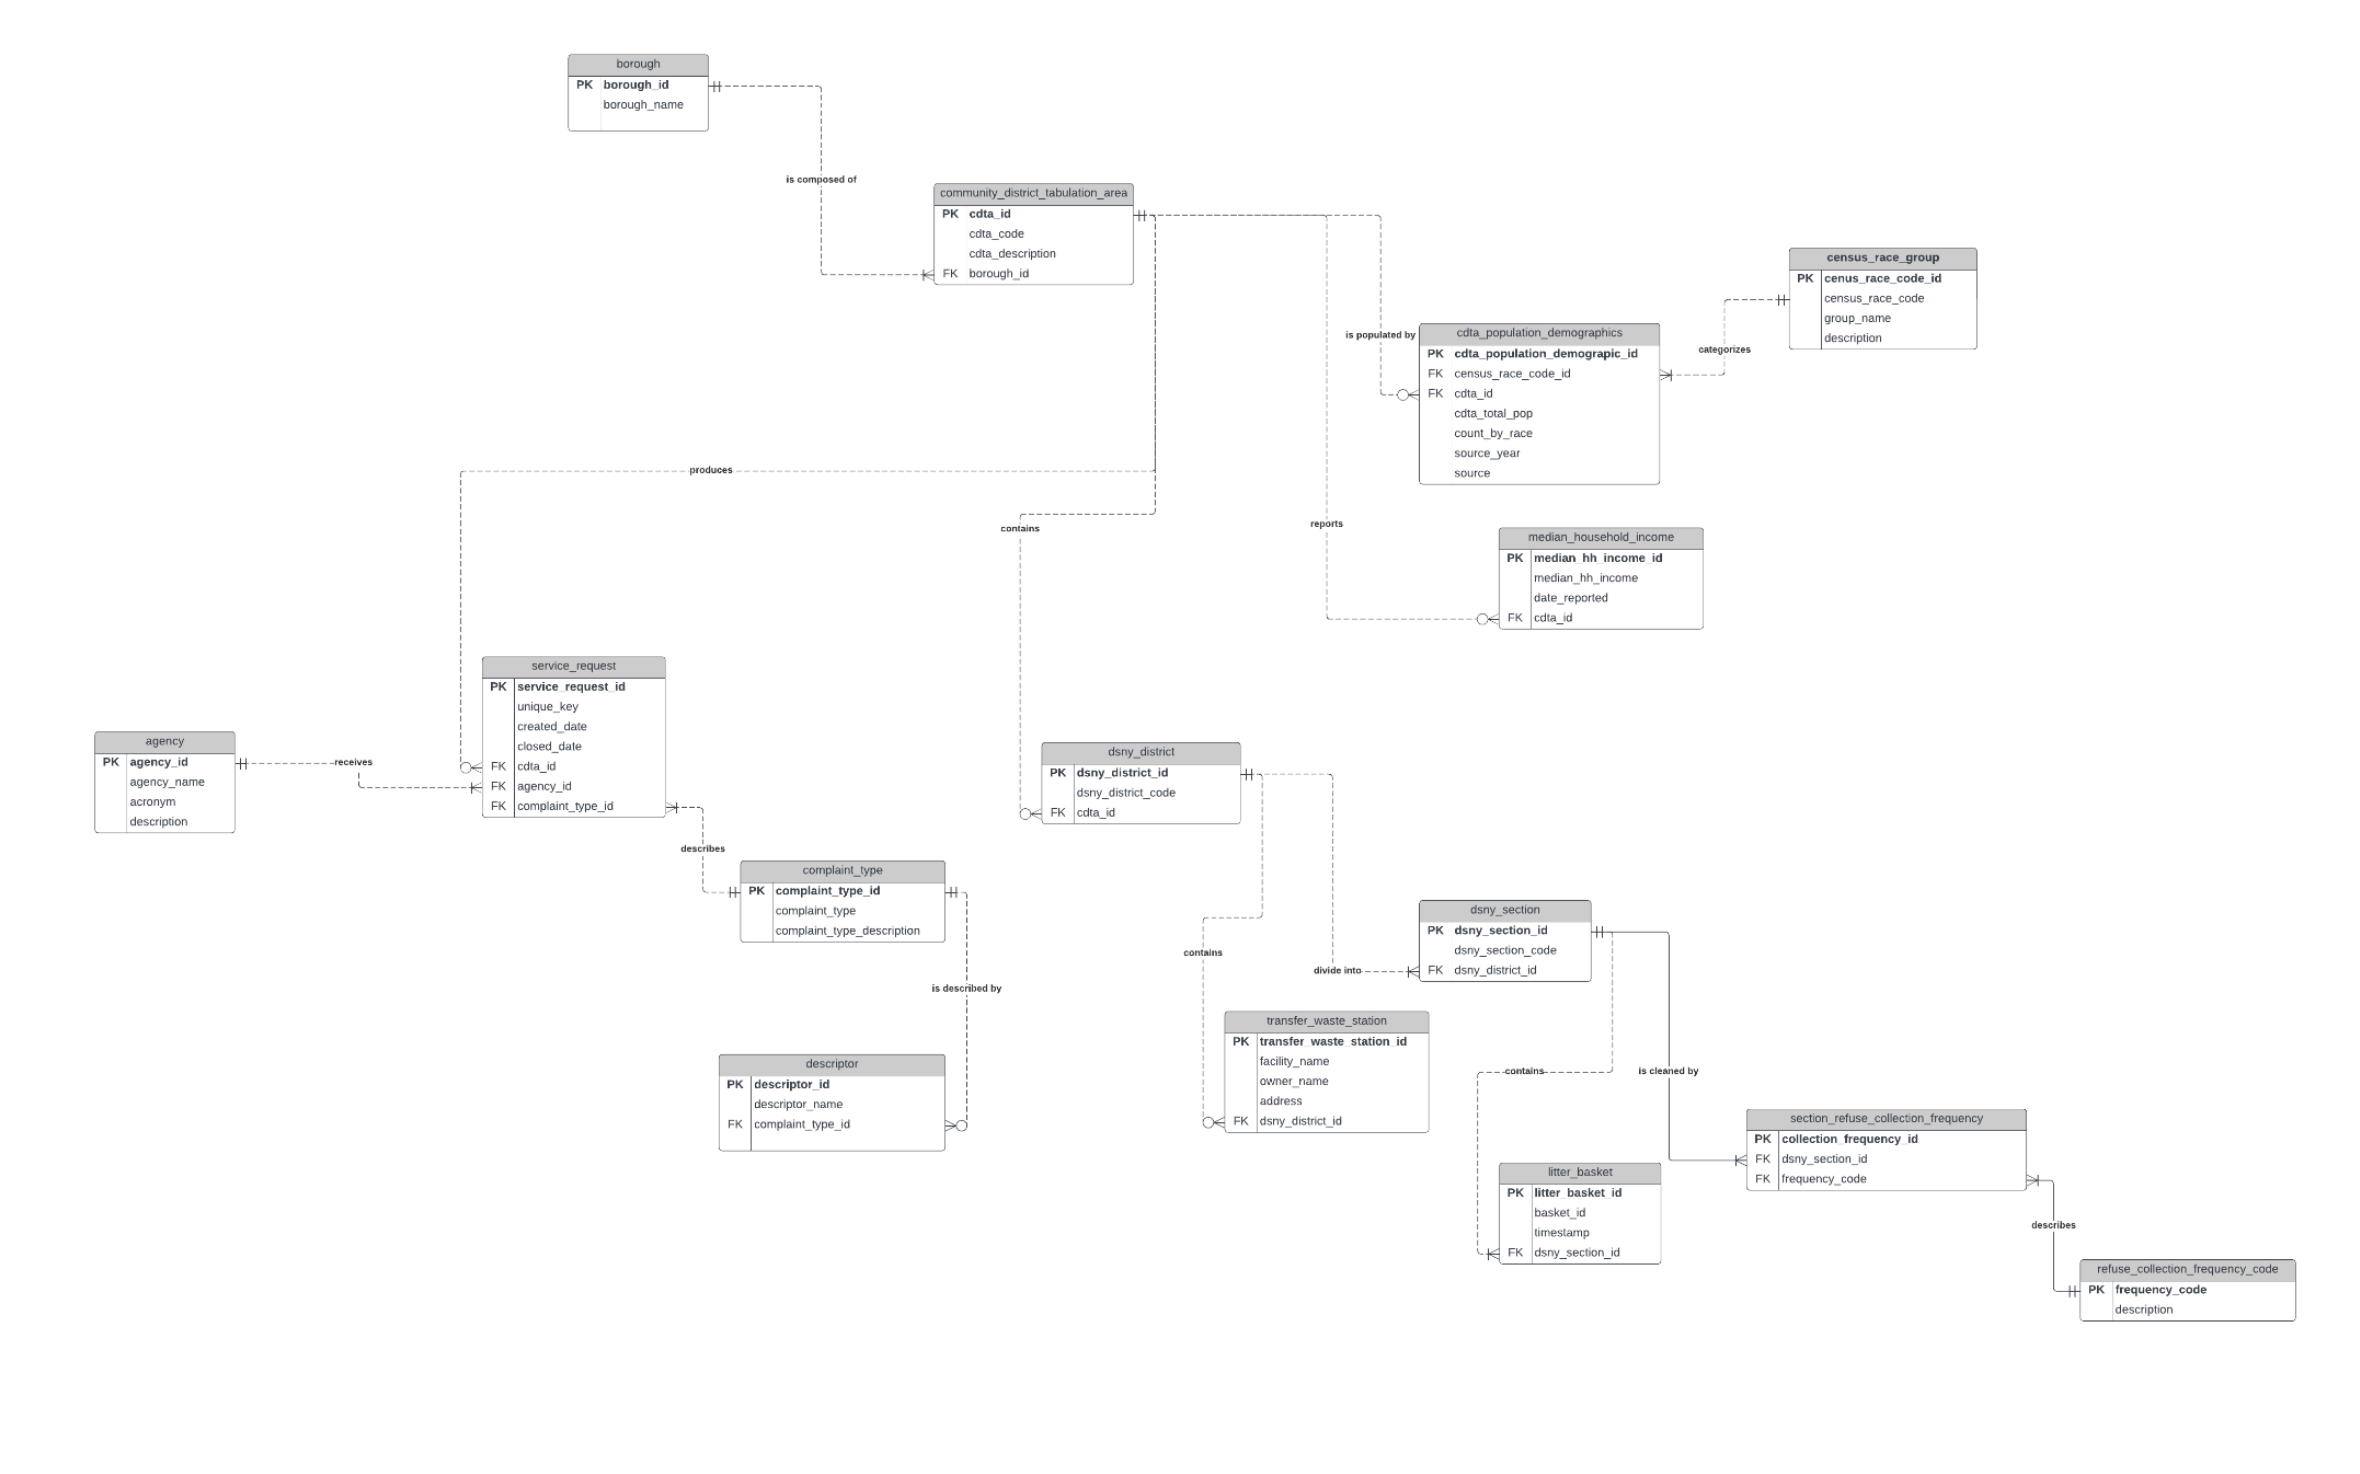
Database Creation and Queries
I then created my database in MySQL Workbench:
 >
>
Example queries explored in this project include:
- What is the most common sanitation-related 311 complaint in each community district?
- What is the most common complaint in majority Black community districts?
- What is the average number of complaints for districts with a waste center?
- What is the average number of complaints for districts without a waste center?
- Which districts have the highest median household income and how many complaints do they receive?
- Which complaint types are most common in districts with high population density?
- What is the most common complaint in majority Black community districts?
- Do lower-income districts have fewer public litter baskets than higher-income ones?
SKILLS
- SQL
- Data Modeling
- Data Processing
TOOLS USED
- MySQL
- Python